- Add visualization on SENTIENT Dashboard
- Use Dashboard time window
- Embed visualization on external site
- Blocked View problem
- Next Steps
All interactive visualizations created with the SENTIENT ANALYTICS Platform could be shared with other users and embed on SENTIENT Dashboards or external sites. In this guide, you will learn how to do this.
Add visualization on SENTIENT Dashboard
Add using share wizard
- Click on Share button in the top right corner of the visualization.
- Select whether you want to add view on new or existing dashboard.
- Select on what dashboard state view should be added.
- Enable
Create alias from filter- enable this option if you want to create dashboard alias that would be used to filter data in view. For example if you created view that shows data from multiple devices - you can use dashboard state alias to filter data by device name. Once alias value changed - filter inside SENTIENT ANALYTICS view would be automatically updated. - Press Save button.
Add via direct link to SENTIENT ANALYTICS view
Once widgets bundle imported, and you already have saved SENTIENT ANALYTICS Visualization - follow next steps to add them on the dashboard:
- In SENTIENT ANALYTICS, open required visualization
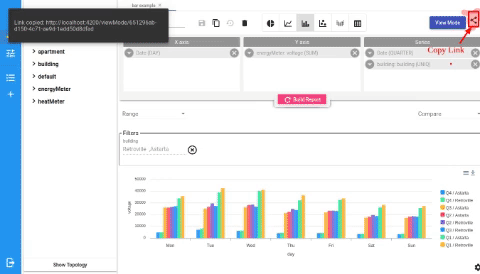
- Press Share button, and click
Copy linkbutton - sharable URL will be copied into the clipboard - Open required SENTIENT Dashboard and press Edit button
- Select Advanced analytics View Static widget from Advanced analytics Bundle and add it on the Dashboard
- Switch to Advanced tab of the widget and insert the copied URL from step 1
- Save dashboard
Use Dashboard time window
By default, all SENTIENT ANALYTICS visualizations use individual time range. However you can change this behavior and configure widget to toke time from SENTIENT Dashboard. This option available for both, Static SENTIENT ANALYTICS widget and for SENTIENT ANALYTICS View with aliases.
- Open Dashboard Edit Mode
- Select required SENTIENT ANALYTICS Widget
- Switch to Advanced Tab
- Enable checkbox Use Dashboard Time Window
Embed visualization on external site
You can also embed SENTIENT ANALYTICS visualization into your web site by adding iFrame that points to required visualization.
Add iFrame on your site with the following URL http://{SENTIENT_ANALYTICS_URL}/viewMode/{VIEW_ID}?jwt={JWT_TOKEN}. Where:
- SENTIENT_ANALYTICS_URL - url of SENTIENT ANALYTICS service
- VIEW_ID - ID of saved visualization inside SENTIENT ANALYTICS
- JWT_TOKEN - SENTIENT JWT token that should be used to authenticate in the SENTIENT
Blocked View problem
If HTTPS was not enabled for SENTIENT ANALYTICS it is possible that visuals shared on 3rd party websites or on SENTIENT Dashboard would be blank.
The problem is that most browser block mixed content requests: if SENTIENT use HTTPS and SENTIENT ANALYTICS does not - browser will block requests to SENTIENT ANALYTICS. You can find detailed error in browser console.
For fixing this - you need to enable HTTPS for SENTIENT ANALYTICS UI. Find details how to do this in SENTIENT ANALYTICS installation guide.
Next Steps
-
Getting started guide - These guide provide quick overview of main SENTIENT ANALYTICS features.
-
Installation guides - Learn how to setup SENTIENT on various available operating systems.
-
Metric Explorer - Learn how to explore and create new metrics with SENTIENT ANALYTICS Metric Explorer.
-
Anomaly Detection - Learn how to identify anomalies in the data.
-
Calculated Fields - Learn about Calculated fields and how to use them.
-
States - Learn how to define and analyse states for assets based on raw telemetry.
-
Prediction - Learn how to make forecasts and predict telemetry behavior.
-
Filters - Learn how filter dataset during analysis.
-
Available Visualizations - Learn about visualization widgets available in SENTIENT ANALYTICS and how to configure them.
-
AI Assistant - Learn how to utilize SENTIENT ANALYTICS AI capabilities.