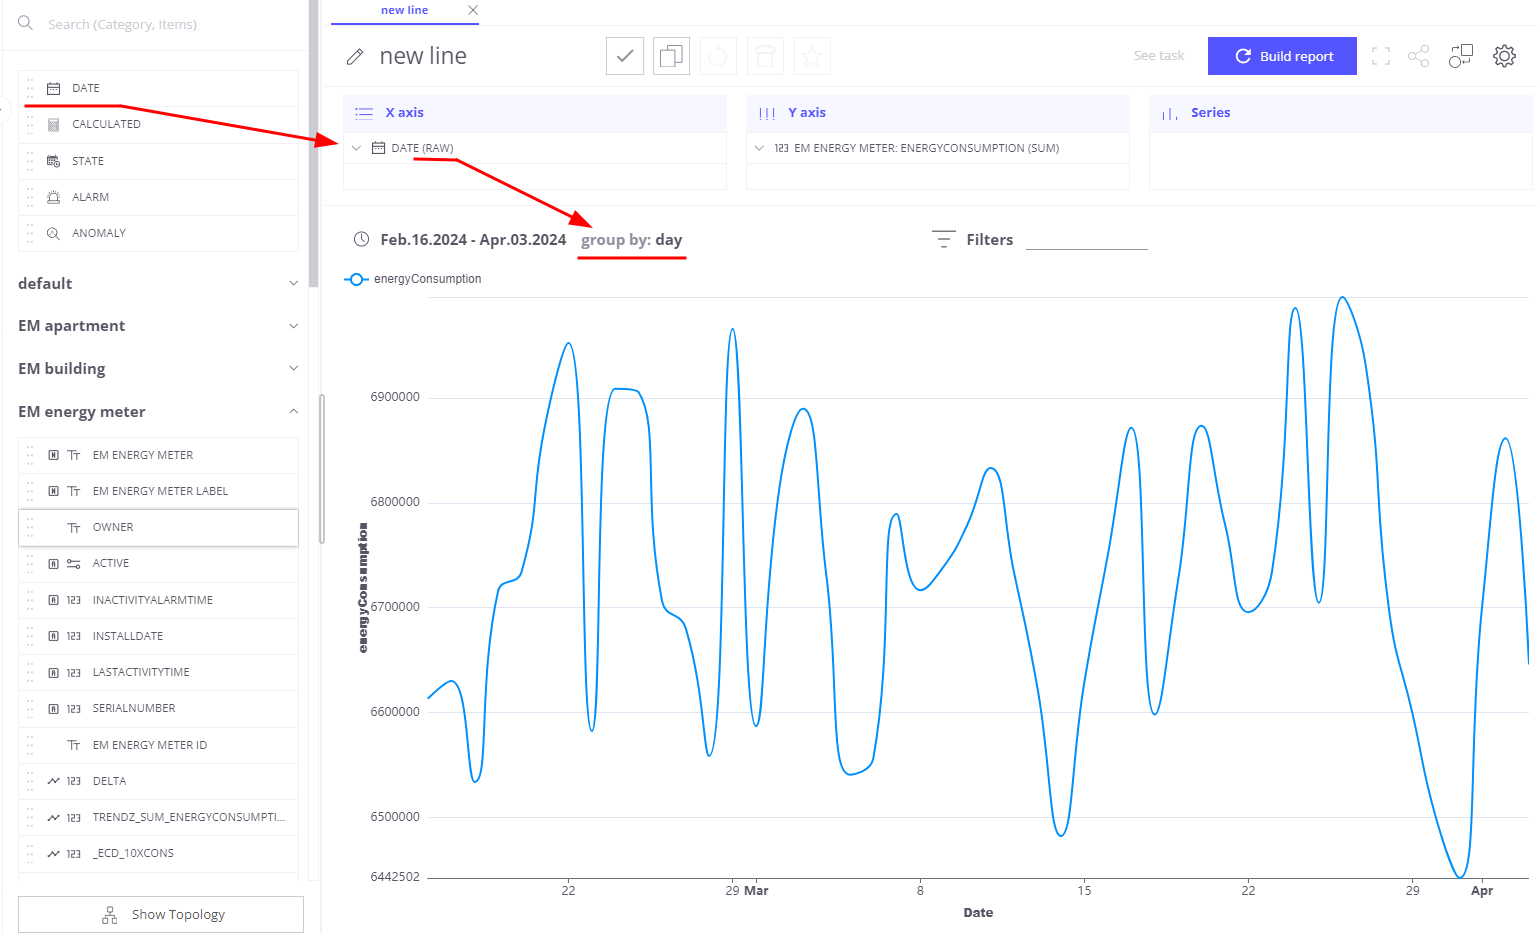
In most cases data is grouped by time interval - by hour, day, week, month, etc. You should use Date field from left panel and drag and drop it the X-axis section.
Default function for Date aggregation is RAW - it means that user can control what is an aggregation interval using Group By combobox near Time Range picker. System will take full range from Time Range picker and devide it into smaller intervals depending on selected value. Latter, selected aggregation function applied for each interval. Allowed values for Group By field are:
- Month
- Week
- Day
- Hour
- Minute
You can have more control on date intervals by selecting other available Date aggregation options:
- RAW,
- MINUTE
- HOUR
- FULL_HOUR - ‘2020-03-01 23’
- DAY - day of the week
- DATE - day of the month
- FULL_DATE - ‘2020-03-01’
- START_OF_WEEK - 2020-03-01
- WEEK_OF_YEAR - numeric week of the year
- WEEK_OF_MONTH - numeric week of the month
- MONTH
- QUARTER
- YEAR
- YEARMONTH - ‘2020-Feb’
Next Steps
-
Getting started guide - These guide provide quick overview of main SENTIENT ANALYTICS features.
-
Installation guides - Learn how to setup SENTIENT on various available operating systems.
-
Metric Explorer - Learn how to explore and create new metrics with SENTIENT ANALYTICS Metric Explorer.
-
Anomaly Detection - Learn how to identify anomalies in the data.
-
Calculated Fields - Learn about Calculated fields and how to use them.
-
States - Learn how to define and analyse states for assets based on raw telemetry.
-
Prediction - Learn how to make forecasts and predict telemetry behavior.
-
Filters - Learn how filter dataset during analysis.
-
Available Visualizations - Learn about visualization widgets available in SENTIENT ANALYTICS and how to configure them.
-
AI Assistant - Learn how to utilize SENTIENT ANALYTICS AI capabilities.